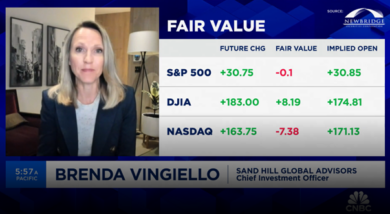
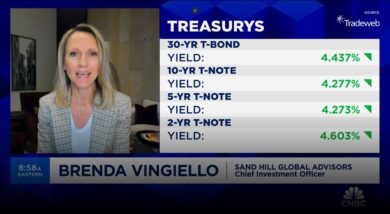
Sand Hill's Chief Investment Officer, Brenda Vingiello, CFA, joins Jenny Harrington on “Halftime Report” to go over their most recent portfolio moves. Brenda's commentary begins

What to Make of the Yield Curve Inversion
Being upside-down, or inverted, can be disorienting as it defies gravity, and the sudden shift in balance can be dizzying and uncomfortable. In late March, the bond market encountered its own unsettling inversion when the yield on the 10-year Treasury dipped below the yield on the 3-month Treasury for the first time in over a decade. This turn of events received a lot of attention because a yield curve inversion has preceded each of the past seven recessions. Questions are now being asked about what this means going forward and what investors should do about it.
First and foremost, a yield curve inversion does not cause a recession in and of itself. Rather, it tends to reflect a market that anticipates slower growth, lower inflation, and a rate cut as the Federal Reserve’s next move rather than a rate hike. These are a lot of assumptions to draw from a simple upside-down line chart. Of course, the Treasury yield curve is anything but simple, and its shape can be affected by several different factors. The Treasury curve typically slopes upwards because investors demand a premium for locking away their money for longer periods of time. The curve recently flattened as the Fed raised short-term interest rates throughout 2018 while the long-end remained low due to ongoing demand because of the very low global interest rate environment. Then, last quarter, the Fed surprised markets when it said it was taking a break from raising rates, and it might not raise rates at all this year. This was a fairly abrupt change from their stated posture as recently as December, and this downgraded Fed forecast led to a rapid repricing in the Treasury market as investors piled into long-term Treasuries, driving prices up and yields down which eventually resulted in the inverted yield curve that got so much attention.
Based on historical data, the longer an inversion lasts and the wider the spread is between short-term bonds and long-term bonds, the stronger the “recession signal” tends to be. The good news here is that last quarter’s inversion was very short and shallow, lasting only five days and inverting by only 0.05%. Research suggests the yield curve needs to be inverted for at least three months to provide a clear signal.
Looking back at half a century of data, it has taken an average of 16 months for a recession to start following a yield curve inversion. During the last economic cycle, the yield curve initially inverted in January 2006, 23 months before the start of the Great Recession. When the curve first inverted, it was also short and shallow, lasting only three days in January 2006. It wasn’t until 18 months later that a more meaningful inversion began and lasted 11 months.
Looking back even further, the yield curve briefly inverted in September of 1998 by an average of only 0.06% and lasted for only a few weeks. Most economists consider this inversion to be a false alarm because it happened a full 31 months before the next recession occurred. The clearer signal came in April 2000, 12 months before a recession began. During those 12 months, the curve was inverted on and off again for four and a half months and by an average spread of 0.46%. Prior to 2000, the yield curve inverted in May 1989, 14 months before the recession in 1990, and the curve remained inverted for about three and a half months by an average of 0.12%.
In other words, the timing between a yield curve inversion and a recession is not instantaneous and a lot can happen in the interim. The bigger question for investors is how to position their portfolios and what to expect from markets going forward. Unfortunately, the yield curve is not a crystal ball, and the reality is that market returns have varied over time. Indeed, most of the time, markets still eke out positive returns during the post-inversion, pre-recession period. Even more encouraging for long-term investors is that while it has taken 16 months on average for a recession to begin after the yield curve inverts, the cumulative average return of the S&P 500 during the 24 months after inversion has been a positive 9.2%.1
Obviously, each cycle is different, and it is important to look at the big picture and not just averages or statistics. In our perspective, the key takeaway from this latest yield curve inversion is that we are later in the economic cycle and global growth has slowed. When determining whether or not we expect to enter a recession in the near term, the yield curve is just one indicator, among many, that we watch. Additionally, in our view, the yield curve is likely to invert again in the future, and we will assess that situation in due course; but investors are more likely to experience a smoother and more rewarding ride if they resist the urge to panic when things are upside-down.
1 Bloomberg. All historical yield curve data has been obtained from Federal Reserve at https://fred.stlouisfed.org.
Articles and Commentary
Information provided in written articles are for informational purposes only and should not be considered investment advice. There is a risk of loss from investments in securities, including the risk of loss of principal. The information contained herein reflects Sand Hill Global Advisors' (“SHGA”) views as of the date of publication. Such views are subject to change at any time without notice due to changes in market or economic conditions and may not necessarily come to pass. SHGA does not provide tax or legal advice. To the extent that any material herein concerns tax or legal matters, such information is not intended to be solely relied upon nor used for the purpose of making tax and/or legal decisions without first seeking independent advice from a tax and/or legal professional. SHGA has obtained the information provided herein from various third party sources believed to be reliable but such information is not guaranteed. Certain links in this site connect to other websites maintained by third parties over whom SHGA has no control. SHGA makes no representations as to the accuracy or any other aspect of information contained in other Web Sites. Any forward looking statements or forecasts are based on assumptions and actual results are expected to vary from any such statements or forecasts. No reliance should be placed on any such statements or forecasts when making any investment decision. SHGA is not responsible for the consequences of any decisions or actions taken as a result of information provided in this presentation and does not warrant or guarantee the accuracy or completeness of this information. No part of this material may be (i) copied, photocopied, or duplicated in any form, by any means, or (ii) redistributed without the prior written consent of SHGA.
Video Presentations
All video presentations discuss certain investment products and/or securities and are being provided for informational purposes only, and should not be considered, and is not, investment, financial planning, tax or legal advice; nor is it a recommendation to buy or sell any securities. Investing in securities involves varying degrees of risk, and there can be no assurance that any specific investment will be profitable or suitable for a particular client’s financial situation or risk tolerance. Past performance is not a guarantee of future returns. Individual performance results will vary. The opinions expressed in the video reflect Sand Hill Global Advisor’s (“SHGA”) or Brenda Vingiello’s (as applicable) views as of the date of the video. Such views are subject to change at any point without notice. Any comments, opinions, or recommendations made by any host or other guest not affiliated with SHGA in this video do not necessarily reflect the views of SHGA, and non-SHGA persons appearing in this video do not fall under the supervisory purview of SHGA. You should not treat any opinion expressed by SHGA or Ms. Vingiello as a specific inducement to make a particular investment or follow a particular strategy, but only as an expression of general opinion. Nothing presented herein is or is intended to constitute investment advice, and no investment decision should be made based solely on any information provided on this video. There is a risk of loss from an investment in securities, including the risk of loss of principal. Neither SHGA nor Ms. Vingiello guarantees any specific outcome or profit. Any forward-looking statements or forecasts contained in the video are based on assumptions and actual results may vary from any such statements or forecasts. SHGA or one of its employees may have a position in the securities discussed and may purchase or sell such securities from time to time. Some of the information in this video has been obtained from third party sources. While SHGA believes such third-party information is reliable, SHGA does not guarantee its accuracy, timeliness or completeness. SHGA encourages you to consult with a professional financial advisor prior to making any investment decision.


